Skip to content

SCADAfence 發現在 Alerton PLC 中檢測到的第一個 CVE

Alerton, a subsidiary of Honeywell, is a major manufacturer of building management systems for heating, ventilation, and air conditioning (HVAC). SCADAfence’s research team discovered vulnerabilities that lead to NIST issuing the first CVEs ever assigned to Alerton products. Left without proper security measures, these vulnerabilities could lead to major disruptions in any facility where they are deployed.

This is a technical report on how our research team discovered these vulnerabilities. 

Alerton Ascent Suite

Alerton Ascent is a suite of controllers, devices, and software used for building management specifically in regard to HVAC. The Ascent product suite is deployed in buildings, server rooms, chemical labs, hospitals and more, with the purpose of maintaining the appropriate air flow and safe temperature required for a room’s or space’s specific need. 

The Alerton Suite is made up of many different components. For example, in the research we conducted the Alerton Ascent network comprised:

  1. Alerton Ascent Control Module (ACM) – Main controller
  2. VLC-853 – Field controller
  3. Alerton Compass – Management and Control Tool
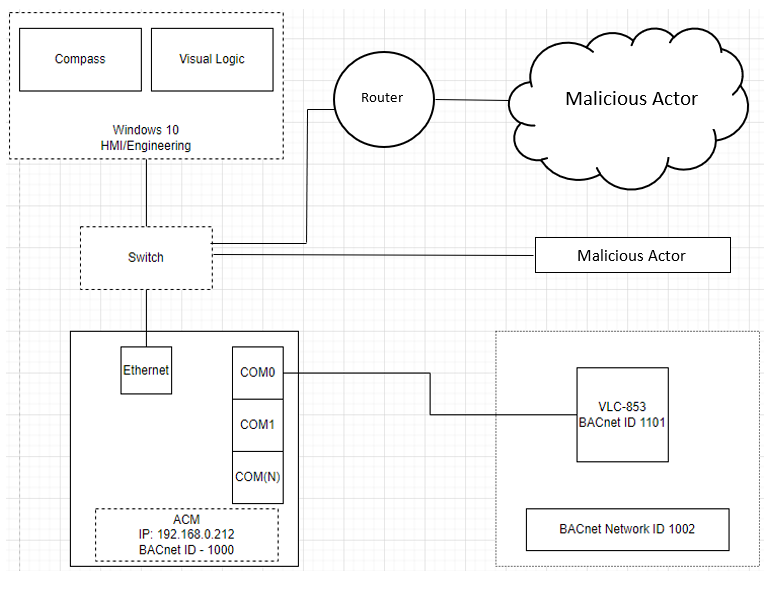
  4. Visual Logic – Programming ToolAlerton Ascent Suite Topology Map

As seen in the topology map, an ACM is connected to a VLC-853 device over a serial port. The Compass software and Visual Logic software have access to the ACM over ethernet via a network switch. 

Any user, innocent or malicious, can access the various Alerton devices and software either locally or remotely via the network switch, assuming that there are no extra security tools providing network protection (such as an FW or switch port security).

The resulting effect of a malicious user gaining access to the Ascent Suite can result in a degradation of credibility, integrity, and availability of the BMS as a whole. 

Configuration Change for Alerton ACM

The Compass software provides the ability to configure the ACM. This configuration includes setting IP values, enabling or disabling specific ports, defining which networking protocols are active and more. In general, the configuration is set when the system is installed and is rarely changed thereafter. 
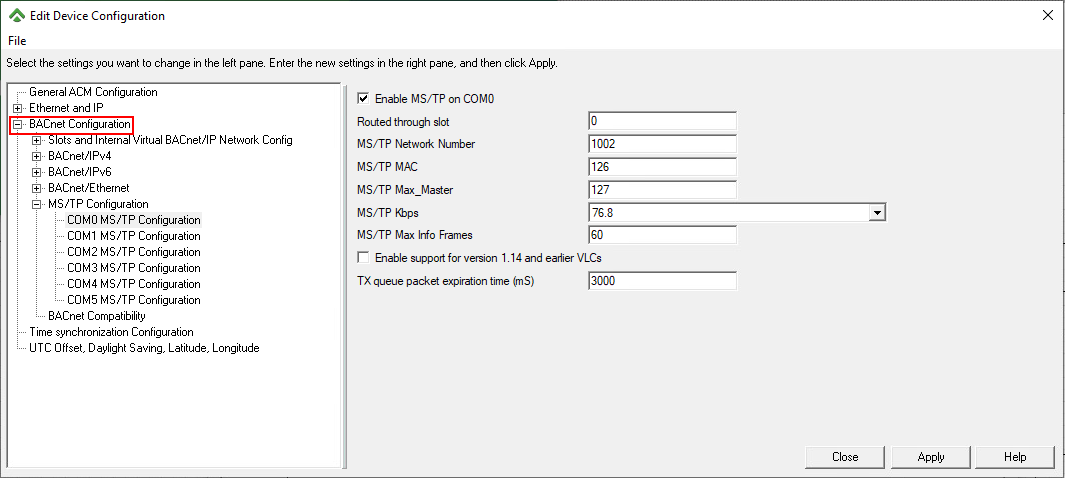
Alerton Config Interface

The Attack – CVE-2022-30242 and CVE-2022-30245

Two of the CVEs that were disclosed, CVE-2022-30242 (cvss 3.x score of 6.8) and CVE-2022-30245 (cvss 3.x score of 6.5), are vulnerabilities discovered which allow for configuration changes to be made outside of the Compass Software without any authorization or authentication. In addition, the configuration changes that were performed are relayed to the Compass Software, leaving the system operator unaware that a change to the configuration occurred. 

The following is a Wireshark partial capture showing how the configuration data is sent over the network from the Compass Software to the ACM: 
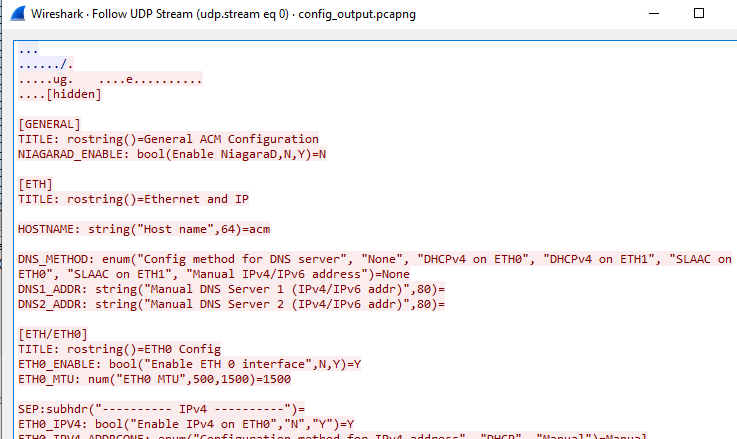
Wireshark capture showing config data sent over the network

As seen in the traffic snippet above from Wireshark, the configuration is sent to the ACM in ASCII characters and in cleartext with no obfuscation and minor difficulty in understanding or changing the configuration data. 

By extracting the whole configuration from the network traffic, and setting the MSTP0 ENABLE field to N, we can simply disable the COM0 port from any computer with access to the ACM. 
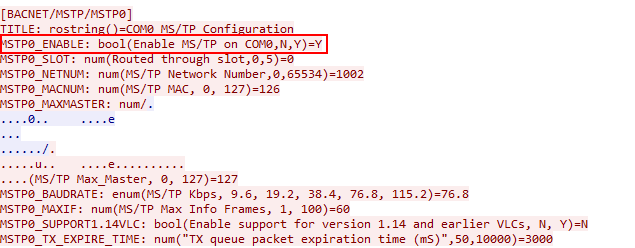
Change sent over the network 

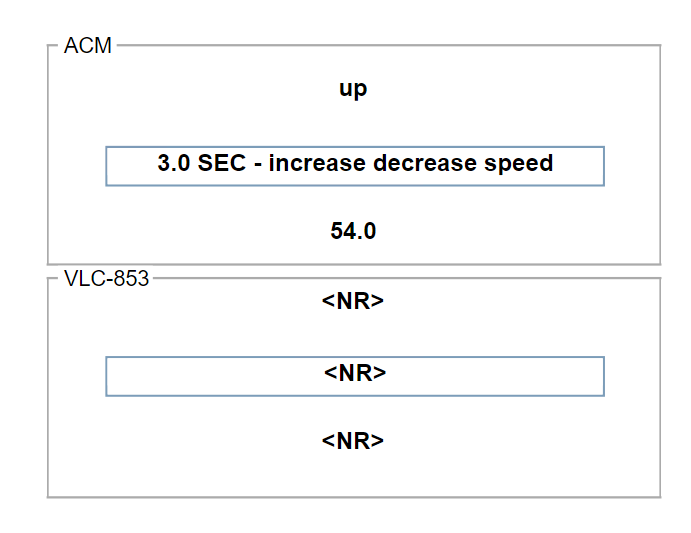
As a result of sending a specially crafted packet with the above change, the configuration of the ACM changed, and COM0 was set to disabled, disconnecting the VLC-853 controller from the ACM: 
  

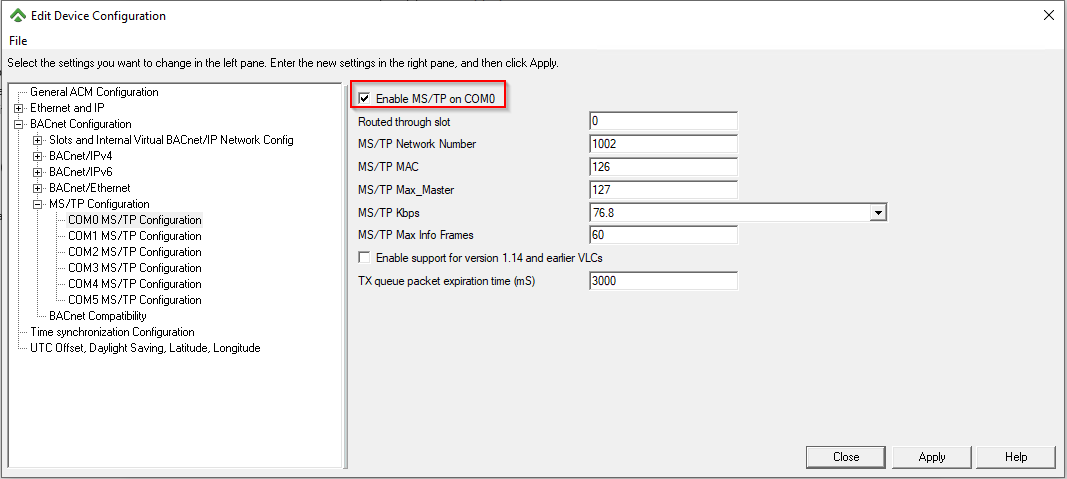
While successful changes in the configuration occurred, the Device Configuration window still indicates to the operator that COM0 is enabled: 


While successful changes in the configuration occurred, the Device Configuration window still indicates to the operator that COM0 is enabled:
In a real life scenario, this can have significant and/or tragic effects. 

Having this vulnerability leveraged in a real life setting can cause connectivity issues or undefined behavior of the entire network. In the example above, COM0 was disabled, which resulted in the VLC-853 to be cut out of the network. 

If the VLC-853 was responsible for ensuring that a cloud storage server room was properly cooled, operators who notice that VLC-853 is not communicating with the ACM and also are unaware that a configuration change occurred, may be compelled to shutdown the server farm out of fear of the servers overheating causing major disruptions for numerous services worldwide. 

This is obviously a single example for a single change in configuration. Any number of other changes can have similar, troubling effects. 

Programming Changes for Alerton Controllers

Programming management for Alerton Controllers is done using an Alerton proprietary plug-in for Microsoft Visio called Visual Logic. Programs written in using Visual Logic use diagrams to display the program in a visual manner as seen below:Visual Logic Program sent to Alerton Controller

Programs are written, pushed to controllers and run by engineers whose task it is to define the programmatic logic of the controller necessary for it to perform its specific role in the network.

Programs are written and edited on an as-needed basis and are not accessed frequently so long as the target device is fulfilling its intended purpose. 

The Attack – CVE-2022-30243 and CVE-2022-30244

In our research, we successfully wrote a program to an Alerton ACM device without authorization or authentication. In addition, the Visual Logic software did not provide an indication that a programming change occurred or that there is a difference in the program saved in the engineering software to that actually running on the ACM. This leaves an operator clueless as to why a controller has malfunctioned, changed its activity or stopped processing altogether.

This resulted in the disclosure of two CVEs, CVE-2022-30243 (cvss 3.x score of 8.8) and CVE-2022-30244 (cvss 3.x score of 8.0)

The packet sequence for writing a program to the ACM is a set sequence of Bacnet commands and is listed, in order as follows: 

With the exclusion of ADD_CODE_BLOCK_PACKET, all of the commands above are static, constant BACnet packets with a dynamic parameter of invoke ID. Being a BACnet system, there are no authorization checks to ensure that the commands being sent are from a reliable and authorized source. 

An attacker who has network access to any of the Alerton controllers can send a maliciously crafted program, using the above sequence of commands, to change a program on the target controller. This is done without the knowledge of an operator, as there is no indication of a program change in the Compass software or the Visual Logic Programming Visio plug-in. 

The following image is a diagram of the program that we pushed to the controller in the previous section; however, an additional component was added and pushed to the controller from a third-party computer with no access to the Visual Logic software:  

VIsual Logic Image of Program Pushed to Alerton Controler

The only indication that a programming change occurred is by clicking the Read from Device button as seen in the image below, and comparing the downloaded program to that which is stored on the engineering station:

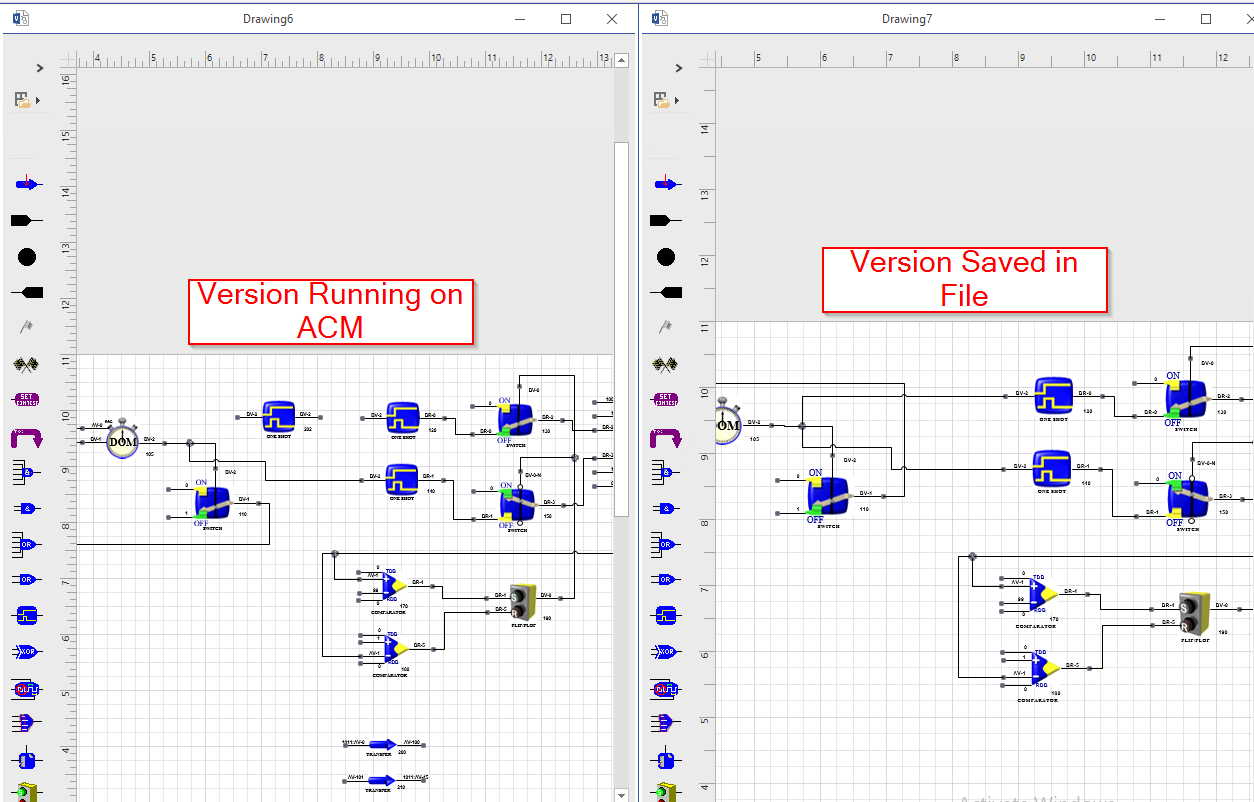
Program Stored On Engineering Station

As with the configuration change vulnerabilities, if these vulnerabilities are leveraged on an Alerton controller in a real-life, production network the effects can be catastrophic. 

If a controller is managing the air flow in a chemical lab, and a program is written to the controller that essentially renders it useless for its current purpose (either by sending a stub program, or sending a program that does not fulfill the air flow requirement), anyone in the lab could potentially be in life threatening situation. 

The potential scenarios that can occur by taking advantage of these vulnerabilities are endless, and can be very serious and even lethal. 

Full details on the CVEs can be found on the official NIST website:
https://nvd.nist.gov/vuln/detail/CVE-2022-30242

https://nvd.nist.gov/vuln/detail/CVE-2022-30243

https://nvd.nist.gov/vuln/detail/CVE-2022-30244

https://nvd.nist.gov/vuln/detail/CVE-2022-30245

In response to SCADAfence’s findings, Honeywell issued a Product Security Bulletin informing Alerton ACM Controller users of the vulnerabilities. 

To learn more about how the SCADAfence Platform can protect your OT network, visit our website or request a demo.

About Version 2 Digital

Version 2 Digital is one of the most dynamic IT companies in Asia. The company distributes a wide range of IT products across various areas including cyber security, cloud, data protection, end points, infrastructures, system monitoring, storage, networking, business productivity and communication products.

Through an extensive network of channels, point of sales, resellers, and partnership companies, Version 2 offers quality products and services which are highly acclaimed in the market. Its customers cover a wide spectrum which include Global 1000 enterprises, regional listed companies, different vertical industries, public utilities, Government, a vast number of successful SMEs, and consumers in various Asian cities.

About SCADAfence
SCADAfence helps companies with large-scale operational technology (OT) networks embrace the benefits of industrial IoT by reducing cyber risks and mitigating operational threats. Our non-intrusive platform provides full coverage of large-scale networks, offering best-in-class detection accuracy, asset discovery and user experience. The platform seamlessly integrates OT security within existing security operations, bridging the IT/OT convergence gap. SCADAfence secures OT networks in manufacturing, building management and critical infrastructure industries. We deliver security and visibility for some of world’s most complex OT networks, including Europe’s largest manufacturing facility. With SCADAfence, companies can operate securely, reliably and efficiently as they go through the digital transformation journey.

了解可觀察性 VS。 監控。 第1部分

The development of clouds, the DevOps movement, and distributed microservice-based architecture have come together to make observability vital for modern architecture. We’re going to dive into what observability is and how to approach the metrics we need to track. Observability is a way of spotting and troubleshooting the root causes of problems involving software systems whose internals we might not understand. It extends the concept of monitoring, applying it to complex systems with unpredictable and/or complex failure scenarios. I’ll start with some of the basic principles of observability that I’ve been helping to implement across a growing number of products and teams at Nord Security.

Monitoring vs. Observability

“Monitoring” and “observability” are often used interchangeably, but these concepts have a few fundamental differences.

Monitoring is the process of using telemetry data to understand the health and performance of your application. Monitoring telemetry data is preconfigured, implying that the user has detailed information on their system’s possible failure scenarios and wants to detect them as soon as they happen.

In the classical approach to monitoring, we define a set of metrics, collect them from our software system, and react to any changes in the values of these metrics that are of interest to us.

For example:

Excessive CPU usage can indicate that we need to scale it up to compensate for increasing system loads;

A drop in successfully served requests after a fresh release can indicate that the newly released version of the API is malfunctioning;

Health checks process binary metrics that represent whether the system is alive at all or not.

Observability extends this approach. Observability is the ability to understand the state of the system by performing continuous real time analysis of the data it outputs.

Instead of just collecting and watching predefined metrics, we continuously collect different output signals. The most common types of signals – the three pillars of observability – are:

  • Metrics: Numeric data aggregates representing software system performance;
  • Logs: Time-stamped messages gathered by the software system and its components while working;
  • Traces: Maps of the paths taken by requests as they move through the software system.

The development of complex distributed microservice architectures has led to complex failure scenarios that can be hard or even impossible to predict. Simple monitoring is not enough to catch them. Observability helps by improving our understanding of the internal state of the system.

Metrics

Choosing the right metrics to collect is key to establishing an observability layer for our software system. Here are a few different popular approaches that define a unified framework of must-have metrics in any software system.

USE

Originally described by Brendan Gregg, this approach focuses more on white-box monitoring – monitoring of the infrastructure itself. Here’s the framework:

  • Utilization – resource utilization.
    • % of CPU / RAM / Network I/O being utilized.
  • Saturation – how much remaining work hasn’t been processed yet.
    • CPU run queue length;
    • Storage wait queue length;
  • Errors – errors per second
    • CPU cache miss;
    • Storage system fail events;

Note: Defining “saturation” in this approach can be a tricky task and may not be possible in specific cases.

Four Golden signals

Originally described in the Google SRE Handbook, the Four Golden signals framework is defined as follows:

  • Latency – time to process requests;
  • Traffic – requests per second;
  • Errors – errors per second;
  • Saturation – resource utilization.

RED

Originally described by Tom Wilkie, this approach focuses on black-box monitoring – monitoring the microservices themselves. This simplified subset of the Four Golden Signals uses the following framework:

  • Rate – requests per second;
  • Errors – errors per second;
  • Duration – time to process requests.

Choosing and following one of these approaches allows you to unify your monitoring concept throughout the whole system and make it easier to understand what is happening. They complement one another, and your choice may depend on which part of a system we want to monitor. These approaches also don´t exclude additional business-related metrics that vary from one component of the software system to another.

Logs

System logs are a useful source of additional context when investigating what is going on inside a system. They are immutable, time-stamped text records that provide context to your metrics.

Logs should be kept in a unified structured format like JSON. Use additional log storage/visualization tools to simplify interaction with the massive amount of text data the software system provides. One very well-known and popular solution for log storage is ElasticSearch.

Traces

Traces help us better understand the request flow in our system by representing the full path any given request takes through a distributed software system. This is very helpful in identifying failing nodes and bottlenecks.

Traces themselves are hierarchical structures of spans, where each span is a structure representing the request and its context in every node in its path. Most common tracing visualization tools like Jaeger or Grafana display traces as waterfall diagrams showing the parent and child spans caused by the request.

Conclusion

Building an observable software system lets you identify failure scenarios and possible risks during the whole system life cycle. A combination of metrics, extensive log collection, and traces helps us understand what’s happening inside our system at any moment and speeds up investigations of abnormal behavior.

This article was just the first step. We’ve covered the standard approaches to metrics and briefly discussed traces and logs. But to implement an observable software system, we need to set up its components correctly to supply us with the signals we need. In part 2, we’ll discuss instrumentation approaches and modern standards in this field.

About Nord Security
The web has become a chaotic space where safety and trust have been compromised by cybercrime and data protection issues. Therefore, our team has a global mission to shape a more trusted and peaceful online future for people everywhere.

About Version 2 Digital
Version 2 Digital is one of the most dynamic IT companies in Asia. The company distributes a wide range of IT products across various areas including cyber security, cloud, data protection, end points, infrastructures, system monitoring, storage, networking, business productivity and communication products.

Through an extensive network of channels, point of sales, resellers, and partnership companies, Version 2 offers quality products and services which are highly acclaimed in the market. Its customers cover a wide spectrum which include Global 1000 enterprises, regional listed companies, different vertical industries, public utilities, Government, a vast number of successful SMEs, and consumers in various Asian cities.