Skip to content

Pandora FMS位於G2的最頂端

Bring it on Pandora FMS! If we have previously told you about our success at the Open Source Awards 2022 and the Peer Awards 2021, today we are here to tell you that we are at it once again!

We are at the top of G2 of Monitoring Software!

“Why is it easier to get unbiased information about a hotel room than about software?”

In 2012, five entrepreneurs asked themselves this question. The next day, they founded G2.

Una plataforma que en la actualidadA platform that currently has more than 60 million visits per year, and on which users can read and write quality reviews on 100,000 software products and other professional services.

More than 1,500,000 reviews have already been published, which help companies around the world make better decisions about how to reach their full potential.

That is why it is so important and honorable that Pandora FMS has become part of its Top 10 of the best Network Monitoring software.

  1. Ninja One
  2. Atera
  3. Logic Monitor
  4. Auvic
  5. Solar Winds
  6. Domotz
  7. Progress WhatsUp Gold
  8. Pandora FMS

Above many other already recognized companies. Such as Microsoft, Datadog, Zabbix, Nagios, Dynatrace, Catchpoint, Entuity, PRTG, Checkmk, Wireshark, Smokeping, OPManager, Netreo, Munin, Cacti and many more.

A badge that appoints Pandora FMS once again as the total monitoring solution:

  • Cost-effective, scalable and able to cover most infrastructure deployment options.
  • Find and solve problems quickly, whether you come from on-premise, multi cloud or a mix of both of them.
  • In hybrid environments where technologies, management processes and data are intertwined, a flexible tool capable of reaching everywhere and unifying data display is needed to make its management easier.

That’s Pandora FMS

You knew it, and now all G2 users know it too!

How did we get into the Top 10 of the G2 platform?

For now, to be included in the category of Network Monitoring, a product must, among other things:

  • Constantly monitor the performance of an entire computer network.
  • Create a baseline for network performance metrics.
  • Alert administrators if the network crashes, or varies, from the baseline.
  • Suggest solutions to performance issues when they arise.
  • Provide network performance data display.

Then comes the usability score of a product, which is calculated using their own algorithm that takes into account the satisfaction ratings of real users.

This rating is also often used by buyers to quickly compare and identify on the page the top-rated products.

The number of reviews received at G2 is also important, buyers rely more on products with more reviews.

Higher number of reviews = Higher representativeness and accuracy of the customer experience

In turn, G2, apart from rating the products based on the reviews collected in its user community, also does so with the aggregated data from online sources and social networks.

And then, participate in the different categories where you can earn badges like the ones we have won:

  • Best Usability. 
  • Easiest to Use.
  • Easiest Admin.
  • Best Meets Requirements.

And as they say over there:

That would be it!

Today we have reached this milestone, and since 2020 we have been winning these categories, all seasons! Let the Himalaya tremble in fear, we continue climbing to the very top!

About Version 2 Digital

Version 2 Digital is one of the most dynamic IT companies in Asia. The company distributes a wide range of IT products across various areas including cyber security, cloud, data protection, end points, infrastructures, system monitoring, storage, networking, business productivity and communication products.

Through an extensive network of channels, point of sales, resellers, and partnership companies, Version 2 offers quality products and services which are highly acclaimed in the market. Its customers cover a wide spectrum which include Global 1000 enterprises, regional listed companies, different vertical industries, public utilities, Government, a vast number of successful SMEs, and consumers in various Asian cities.

About PandoraFMS
Pandora FMS is a flexible monitoring system, capable of monitoring devices, infrastructures, applications, services and business processes.
Of course, one of the things that Pandora FMS can control is the hard disks of your computers.

MS Windows和Pandora FMS中的事件,有沒有人給出更多?

Diving into Internet of Things Statistics

An Internet of Things (IoT) device simply means a device which can communicate back and forth with a central hub, mainly via WiFi but also using technologies such as SIM cards and radio frequencies. We are living in the age of digital connectivity, if it can have an IP address then you best believe it’ll have one assigned. From Samsung’s AI-powered Family Hub Smart Fridge which tells you what recipes you can make based on the ingredients inside, to Tesla vehicles with over-the-air updates for not only the software but also actual motor components (a 2018 update on the Model 3 to adjust the anti-lock algorithm which helped with braking distance).  

Consumer technologies aren’t alone when it comes to utilizing the Internet of Everything. Industries such as healthcare have their own use case. Internet of Medical Things (IoMT) such as smart sensors for monitoring patients’ vitals are an essential piece of equipment in modern healthcare facilities.  

The statistics back this growth: there are already more active IoT devices (10 billion) than people on earth. It’s expected that there will be over 30 billion total IoT devices by 2025, with the market value projected to reach $875 billion by that time. Every second over 100 new IoT appliances connect to the public internet. It’s so widely adopted that almost a third of the US population own a smartwatch. This sharp increase in devices has a clear effect on the global volume of data being transported, the graph below shows year to year growth.  

Cyber Threats & Vulnerabilities of IoT

As the Internet of Things rapidly grows, the cyber threats and associated risks continue to evolve and become increasingly complex with hackers coming up with new ways to breach devices and networks. Every organization should be aware of their own network attack surface, which is the totality of all vulnerabilities from connected devices and hardware. Each device poses a possible point of entry for an unauthorized user to gain access. Ideally you keep your attack surface as small as possible, making it easier to protect. But for some organizations, this simply isn’t a possibility, as there might be a need for thousands, if not hundreds of thousands of IoT sensors to report on key analytics.  

As mentioned earlier, the healthcare industry has a sizable use case when it comes to IoT devices. An issue with this is the cost associated with these complex pieces of equipment such as MRI scanners and X-ray machines. It simply isn’t feasible for these items to be upgraded regularly, which in turn leads to outdated and unsupported systems still playing a key role in the infrastructure. As an example, Windows 7 support was discontinued in January of 2020 after 10 years in operation, creating an untold number of vulnerabilities for organizations around the globe. According to a report from Palo Alto Networks cybersecurity division Unit 42, 83% of medical imaging devices are running unsupported operating systems.  

IoT devices suffer from a range of other vulnerabilities, including: 
  • Weak/default passwords and settings: Back in 2016, the largest DDoS attack ever at the time was launched against the service provider Dyn using a botnet powered by IoT devices. Hackers used a piece of malware called Mirai, which after initially infecting a computer would continue searching for vulnerable IoT devices and use default usernames and passwords to login. These credentials can be found online easily, and if the network operator doesn’t change them, anyone can gain access. 
  • Poor device security from the manufacturer: When a device communicates in plain text, all information that is being transferred can easily be intercepted via a Man-in-the-Middle attack. 
  • Outdated IoT firmware: A large percentage of IoT devices use third-party libraries for their firmware, these can easily become outdated and with the lack of ability to update the firmware on some devices, this poses an issue. 
  • Protecting your IoT Devices and Network: Network administrators need to realise that with these new devices they need to ensure they are keeping up with the essential security solutions. Strong passwords, firewalls and anti-virus software simply isn’t sufficient. The first step in protecting your IoT devices is to learn and understand what the most likely cyber threats are. Create a threat model which identifies, evaluates, and prioritizes potential vulnerabilities. Having a documented network is essential, a well-maintained network management system with advanced monitoring will massively help identify weak spots in the network.  
Basic IoT network security measures include:
  • VLANs: Placing the IoT devices in their own VLAN with total segregation from the rest of the network. This doesn’t have to be anything overly complicated, just set some simple rules such as trusted and untrusted depending on how much faith you have in the device. E.g. A Nest smoke alarm can be placed in the trusted VLAN and have access to the internet but a cheap Chinese thermometer would go in the untrusted VLAN and not have access to anything else.  
  • Static IPs: If it is possible to assign a static IP, definitely do so. This helps you to keep track of the device and can make troubleshooting a whole lot easier. Another benefit of this is helping with identifying new devices on the network. 
  • MAC Address whitelisting: An easy way of ensuring only authorized devices can access your company network. But it is important to note that these can be easily spoofed. 
Advanced IoT security measures include:
  • Modern Network Access Control (NAC): Traditional NAC solutions don’t scale well when it comes to IoT. Standard IEEE 802.1x security protocols are mostly incompatible with IoT devices. As mentioned above, MAC authentication can be spoofed. With NAC, network administrators are able to configure and enforce security policies and analyze device risk postures. 
  • Automated configuration: Having an automated onboarding system in place for new devices is a smart idea. If your company has a large number of IoT devices, it can be easy for some to slip through the security configuration if done manually.  
  • Device certificates: Using X.509 device certificates to manage the identity and security of devices adds another layer of security. These certificates play a key role in PKI-based security and serve as proof of device authenticity by authentication, encryption, and data integrity. 
  • Secure API connections: APIs are commonly used to transfer data between applications and devices. This can give way to a whole host of cyber threats. It is essential that only authorized systems can communicate with the API. The use of tokens to establish trusted identities and provide access to the appropriate services is highly recommended. 

About Version 2 Digital

Version 2 Digital is one of the most dynamic IT companies in Asia. The company distributes a wide range of IT products across various areas including cyber security, cloud, data protection, end points, infrastructures, system monitoring, storage, networking, business productivity and communication products.

Through an extensive network of channels, point of sales, resellers, and partnership companies, Version 2 offers quality products and services which are highly acclaimed in the market. Its customers cover a wide spectrum which include Global 1000 enterprises, regional listed companies, different vertical industries, public utilities, Government, a vast number of successful SMEs, and consumers in various Asian cities.

About PandoraFMS
Pandora FMS is a flexible monitoring system, capable of monitoring devices, infrastructures, applications, services and business processes.
Of course, one of the things that Pandora FMS can control is the hard disks of your computers.

什麼是遠程網絡監控?

Remote network monitoring is a technical specialty that was born almost at the same time as networks themselves. Since then, many strategies have emerged when it comes to monitoring network elements.

In this article we will talk about the current techniques based on SNMP polling and network statistic collection through Netflow, and we will also mention outdated systems such as RMON.

Most techniques are purpose-oriented, so they are especially useful. Some more modern ones use combined techniques to offer higher control and network knowledge.

What advantages does each one of them offer?

What is remote network monitoring?

Remote network monitoring consists of detecting and knowing the status of any device connected to the network.

It can be network-specific hardware (such as a router, server, printer) or a specialized device (such as a probe or IoT element).

Simple, right?

Then let’s talk about the different techniques you have to monitor a network remotely.

Basic Remote Network Monitoring Techniques

Often this monitoring takes place through basic techniques.

With basic techniques we mean something as well known as pinging and checking whether the computer responds to the network.

What is pinging? It is a communication mechanism that allows you to find out whether a computer is connected and responds when you “knock” on its door.

To use it you just have to know its IP address.

Other basic techniques include measuring latency times (network lagging) or packet loss (network packet loss).

Advanced Remote Network Monitoring Tool – Netflow

The most common and already much more network specific techniques include the use of the SNMP protocol (Simple Network Monitoring Protocol) that helps to obtain specific information from devices connected to the network: number of connections, incoming traffic through its network interface, firmware version, CPU temperature, etc.

Something that, if we use technical terms, is known as SNMP polling.

Other tools use protocols from the Netflow family (JFlow, SFlow, Netflow) to obtain statistical information about network usage.

This statistical information is incredibly useful to be able to analyze the use of the network, detect bottlenecks and, above all, to have a clear vision of what the communication flows between the different elements of a network are.

Advanced Network Remote Monitoring Techniques – RMON

There is an almost obsolete protocol called RMON. However, it is worth mentioning, because we can still find it in some installations.

This protocol used a technology network monitoring technology that listened to the wire to obtain statistical information using a specific SNMP agent. Something like what Netflow does.

Advanced Remote Network Monitoring Tools – SNMP Traps

On the other hand, most devices still use SNMP TRAPS to report incidents in asynchronous mode.

Although it is a very old method, it is still used today as a monitoring method on almost all network devices.

Not to be mistaken with the SNMP Polling that we discussed at the beginning!

Benefits of Network Monitoring

The most important and simple benefit is to find out the status of the network:

  • Whether it is active
  • Whether it is overloaded
  • Which devices have the most traffic
  • What kind of traffic is circulating over the network
  • Bottlenecks
  • Jams

An example of a traffic flow diagram captured with Pandora FMS could be the following:

Remote network monitoring tools

Most network management and monitoring systems automatically detect connected systems and draw a network map representing the network.

The most advanced tools allow you to update that map in real time and see even the physical connections between interfaces (known as a link-level topology or Layer 2).

For example, like this automatic network map generated with Pandora FMS:

Remote monitoring in network management

Some systems incorporate what is known as IPAM (IP Address Management) and, at the same time, monitor the network status, allowing IP addressing to be mapped and controlled so that you know which networks are free and how they are used.

How does a remote network monitoring service work?

Generally, a tool like this one has a central server that allows you to detect systems and launch network tests (ping, icmp, snmp) to find out the status of each device. 

To know the network in detail through its network flows in real time, you will need to configure the network routers and switches with the Netflow protocol and send that information to a Netflow collector. Although only professional medium/top-range network equipment supports the use of Netflow.

If you use an advanced monitoring tool, it will have its own Netflow collector.

Sometimes it is necessary to monitor devices that are in inaccessible networks, so intermediate polling servers, called proxies or satellites, are used.

These secondary servers perform network scans and monitoring on the devices nearby, and then send the collected data to a central system.

But what do we do with all this numerical data?

It is essential that the monitoring tool you use has graphs, reports and visual screens to display that data.

If we’re already talking about the top-of-the-range tools, those visual network maps will allow you to manually correct and add the details you need to manage those networks.

What are the best remote network monitoring software?

The professional tools that cover SNMP, Netflow, network maps and IPAM that work best today are:

  • SolarWinds
  • Whatsup Gold
  • Pandora FMS

Although they differ from each other in several respects, you may cover all your monitoring needs with any of them.

Would you like to know more about remote network monitoring tools? Then this will no doubt interest you:

Best network monitoring systems

Not all market tools cover these areas.

Some only support basic SNMP, but do not support Netflow. Others do not have good discovery or map editing capabilities and most of them do not have IPAM features. 

The basic thing a good network monitoring tool should have is:

  • SNMP v1, v2 and v3 capabilities
  • To be able to use proxy servers
  • SNMP Trap Collection
  • Device Discovery
  • Map drawing

About Version 2 Digital

Version 2 Digital is one of the most dynamic IT companies in Asia. The company distributes a wide range of IT products across various areas including cyber security, cloud, data protection, end points, infrastructures, system monitoring, storage, networking, business productivity and communication products.

Through an extensive network of channels, point of sales, resellers, and partnership companies, Version 2 offers quality products and services which are highly acclaimed in the market. Its customers cover a wide spectrum which include Global 1000 enterprises, regional listed companies, different vertical industries, public utilities, Government, a vast number of successful SMEs, and consumers in various Asian cities.

About PandoraFMS
Pandora FMS is a flexible monitoring system, capable of monitoring devices, infrastructures, applications, services and business processes.
Of course, one of the things that Pandora FMS can control is the hard disks of your computers.

你想知道一個危險的陌生人是否有你的密碼?

We already live in a post-apocalyptic future that has nothing to envy to great franchises like Mad Max or Blade Runner.

Proof of this are pollution, pandemics and the fact that your most intimate secrets can be violated because your most impenetrable slogans are in a database of leaked passwords.

Do you feel that pinch? It’s fear and cruel reality knocking at your door at the same time.

But, well, let’s stand by. Just as Mel Gibson or Harrison Ford would do in their sci-fi plots. Let a hard guy grimace get drawn on your face, adjust your pistol grip and put on comfortable shoes. Help us and help yourself answer this question:

Are you in a database of leaked passwords?

You already know that periodically, the security of large companies that store hundreds of data, including your passwords, is violated with total impunity.

We have repeated it countless times: No one is free from evil because, friends, evil never rests. And on top of that, there are no superheroes for these things.

That is why we will try to guide you to check, in a simple way, whether you and your passwords are in a database of leaked passwords.

That way you will find out whether you are safe or you already have to start thinking about coming up with new and original passwords.

*Remember

No matter how far-fetched and armored it may seem, from time to time you will have to check if it has been leaked. We do not want anyone with bad intentions to use them and take advantage of some of the services you have hired or, directly, steal your information. 

To guide you in this search what we will do is start by checking your emails. We will check whether they are included in some of these databases of leaked passwords. That way we will not only reveal if these have been filtered, but also the rest of the accounts in which you repeat the same username and password over and over again.

Is all this necessary?

Between you and me, it’s easier to memorize a password than to try it with hundreds. That’s why you repeat the same one since your teenage days! Damn it… maybe even since you met messenger and Terra chat. 

But this is a very dangerous thing! If someone has already obtained your old hotmail email and the password you used in it, and that you may continue to use, what they will do is, apart from appropriating your email, is to use that information to enter other platforms or services where you continue to use the same username and password as in that hotmail. 

Once you know whether any of the credentials that you usually repeat have been leaked, you will have in your hand the option to change them both on the site that has been violated and in the rest of the places where you use them. 

How do we do it?

To find out whether the passwords of any of the websites in which you have registered have been violated and filtered, you just have to go to:

haveibeenpwned.com

A portal that is responsible for collecting information from password databases filtered throughout the Internet.

*The page is quite intuitive. It works as a search engine. As the main Google page. So calm down.

Let’s go with a small list of steps to follow:

  1. Enter haveibeenpwned.com.
  2. Go to the main text box. In there type the email account you want to verify. You will be immediately shown the accounts or platforms, linked to it, that have been breached.
  3. If after typing your email and pressing enter, the screen turns green, you are in luck, your email has not been involved in any massive leak.
  4. However, if the screen turns to a maroon shade… Shit! The password linked to that email has been leaked! What’s more, the very attentive page will tell you where. Below you will see a list of websites where you used to enter with that email and where the passwords have been stolen.
  5. Go change passwords! Both from your email and from all the pages that appeared to you. Well, and the rest where you may be using the same username and password that you used with the compromised accounts.

Conclusions

We know it’s a hassle to change passwords every once in a while, but so is it to have your account stolen and impersonate you by putting a horrible profile picture. This among many other unmentionable bad deeds that can be done. Now that you can check whether you’re in one of those leaked password databases, we leave it to you.

About Version 2 Digital

Version 2 Digital is one of the most dynamic IT companies in Asia. The company distributes a wide range of IT products across various areas including cyber security, cloud, data protection, end points, infrastructures, system monitoring, storage, networking, business productivity and communication products.

Through an extensive network of channels, point of sales, resellers, and partnership companies, Version 2 offers quality products and services which are highly acclaimed in the market. Its customers cover a wide spectrum which include Global 1000 enterprises, regional listed companies, different vertical industries, public utilities, Government, a vast number of successful SMEs, and consumers in various Asian cities.

About PandoraFMS
Pandora FMS is a flexible monitoring system, capable of monitoring devices, infrastructures, applications, services and business processes.
Of course, one of the things that Pandora FMS can control is the hard disks of your computers.

SNMP監控: 使用簡單網絡管理協議的提示

SNMP protocol, whose first version was officially released on 1990 and means Simple Network Management Protocol, is the easiest and simplest way a sysadmin has in order to manage and diagnose problems inside his network devices.

Let’s see what is, how snmp works and why this simple protocol is the essential key for a smooth network environment.

What is SNMP?

In the most general terms, network monitoring means the use of available communication protocols to collect information on the status of communication systems, whether they be routers, land line communications or cell phones. Among them, SNMP raises as the most used monitoring tool.


Do you want to know more about network monitoring?

Remote networks, unified monitoring, intelligent thresholds… discover network monitoring in Pandora FMS Enterprise version.


As we previously said, SNMP works as a mechanism of communication between network devices and a network administrator. Routers, switches, servers, printers…, most of every and each network device supports SNMP protocol. Not only with informative purposes, but also to perform different actions inside those devices (such as remote configuration).

How does SNMP work?

Belonging to the application layer (7th layer of the OSI model), allows communication between network devices. Those known as SNMP agents (request receivers) work in a set of predefined UDP ports, known as SNMP port or SNMP ports. Request receiving port (sent by any available port) is UDP 161 and UDP 162 is used to receive notifications (also known as SNMP trap port).

SNMP protocol works in two different ways: SNMP polls and traps. Polling consists of launching remote queries, either actively or on demand, carrying out operation queries synchronously. Traps, meanwhile, are messages sent by SNMP devices asynchronously, according to changes or events, to configured addresses.

To get the most out of SNMP monitoring, it’s best to use both modes when setting up a monitoring system.

SNMP versions

SNMP currently has three different protocol versions, gathered in different RFCs over time (since first ones on 1988, until today).

Those versions are:

  1. SNMPv1 – defined in RFC 1155, 1156 and 1157, defines the way SNMP works.
  2. SNMPv2 – communication and security improvements of first version. It has two subversions, one on which security is community based (version SNMP2c, RFCs 1901 and 1908), and one on which security is user based (version SNMPv2u, RFCs 1909 and 1910).
  3. SNMPv3 – this third version, which includes and improves security and encryption, has struggled to find a market. The SNMP v3 is defined in RFC 3411 and 3418 and, since 2004, SNMPv3 is known as the actual standard protocol version.

SNMP alerts

Therefore, after knowing how SNMP protocol works, it is clear that one of its main uses are the alerts generated by all devices. Two types can be found in a SNMP monitoring network: synchronous alerts, those requested by an agent SNMP request (known as SNMP polling alerts), and asynchronous alerts, without agent request (known as SNMP traps or snmtraps).

This alert and notification system is the true key of SNMP protocol used in network monitoring tools base their operation of custom alerts. For example, in Pandora FMS we handle a wide range of custom alerts that can be triggered based on these SNMP alerts.

Now lets discuss in more detail what are and how monitoring works based on SNMP polling and SNMP traps.

SNMP trap monitoring

First configure your devices to send traps when specific circumstances are met, and secondly set up a tool that can collect the SNMP traps it receives, whether it be a machine with the necessary services, or a piece of monitoring software. How you configure the SNMP devices will depend on the manufacturer’s model and the device itself, and is carried out from a management interface accesible via a browser and its IP address.

Traps can be received in Linux by using the demon snmptrapd, installed as follows, e.g. on CentOS systems:

# yum install net-snmp-utils net-snmp-libs net-snmp

In our example we’re going to use Pandora FMS to receive and process the SNMP traps. If you already have a Pandora FMS server installed you won’t need any new dependencies, but you’ll have to enable it to receive the traps. Search for snmpconsole in the pandora_server.conf file and enable it as follows:

snmpconsole 1

Once the SNMP traps console is enabled Pandora FMS will be able to receive and process them and display them in the corresponding section:

snmp monitoring

To ensure the incoming traps are arriving correctly, you can consult the corresponding log file, usually at: /var/log/snmptrapd.log.

SNMP trap alerts

Alerts can also be configured via SNMP monitoring for the traps we prepared. In this case they won’t function in the same way as any other module, unlike with SNMP polling, but instead are based on filtering rules. Using these rules we can identify traps belonging to other devices, filter the contents of said trap, OID, etc..

In the next screenshot you can see various alerts created with different filtering options, and actions checking that everything is working fine:

snmp monitoring

SNMP polling monitoring

The protocol works by launching a query against an IP address and requires a specific parameter: the SNMP community string, an alphanumeric chain used to authorize the operation, and which adds an extra layer of security. When an SNMP check is launched against a compatible device, you get a list containing a lot of data that can be difficult to interpret at first:

# snmpwalk –v 1 –c public 192.168.50.14

snmp monitoring

monitorizacion snmp

Each line returned by snmpwalk has an OID (object identifier) and corresponds to a piece of data determined by the device. To better understand what the values returned by the SNMP check are, you can install the system manufacturer’s MIBs (management information base). MIBs are libraries that translate these numeric chains into a legible format allowing us to interpret the data.

Let’s look at some data we’ve got back after executing an SNMP check with the MIBs installed:

snmp monitoring

There are also web sites where you can consult any of these OIDs in case of doubt. If you know the OIDs you want to monitor, you can carry out the query like this by indicating the alphanumeric code that appears after the IP address in question:

monitorizacion snmp

# snmpwalk –v 1 –c public 192.168.1.50 IF-MIB::ifPhysAddress.2

snmp monitoring

Done like this, only the values of the SNMP object queried will be shown, so if you have a monitoring tool the data will be included in the different checks. In this case, we created a basic SNMP monitoring for a few devices using Pandora FMS, and the result is as follows:

snmp monitoring

snmp monitoring

SNMP polling alerts

Once data collection on modules via SNMP polling is being carried out, we can create alerts on Pandora FMS for those modules, executing actions proactively in function of the thresholds we’ve configured, and they work in the same way as any other alerts for any modules on Pandora FMS.

SNMP modules in Pandora FMS

We built Pandora FMS as a flexible monitoring software, capable of monitoring devices, infrastructures, applications, services and business processes. Among them, we have a complete SNMP module.

About Version 2 Digital

Version 2 Digital is one of the most dynamic IT companies in Asia. The company distributes a wide range of IT products across various areas including cyber security, cloud, data protection, end points, infrastructures, system monitoring, storage, networking, business productivity and communication products.

Through an extensive network of channels, point of sales, resellers, and partnership companies, Version 2 offers quality products and services which are highly acclaimed in the market. Its customers cover a wide spectrum which include Global 1000 enterprises, regional listed companies, different vertical industries, public utilities, Government, a vast number of successful SMEs, and consumers in various Asian cities.

About PandoraFMS
Pandora FMS is a flexible monitoring system, capable of monitoring devices, infrastructures, applications, services and business processes.
Of course, one of the things that Pandora FMS can control is the hard disks of your computers.

使用Pandora的網絡地圖

The wait is finally over, and the seventh version of Pandora FMS, “Next Generation” has arrived to keep your networks in working order, and more. Now including UX monitoring, transaction monitoring, extra features and visual highlights, interactive network maps and events history. It’s difficult to imagine that there is a more powerful and complete monitoring software currently available. We’re excited to talk about the new network maps upgrades, but if you’d like to find out about the other new additions click here.

The glowing iridescent Pandora FMS Omni-Brain that directs the office hive-mind has instructed the developers to make changes to the network maps function, consolidating both Open and Enterprise versions into a single tool, all-in-one. It’s now possible to display network maps totally visually and dynamically, with greater interaction possibilities, and represent any kind of network topology, including manual L2 links. You can also view all and any sub-networks that your organization is running and/or maintaining, on- or off-site; create hierarchy relations allowing a greater level of topological detail than ever before.

Creating network maps

Network maps can be created from:

  • An agent group, if there are hierarchy relations between nodes in a group and these are going to be shown on the map.
  • A network mask, to define the boundaries of a sub-network.
  • Finally, one of the most usual ways, via self-discovery tasks. A reconnaissance task can be carried out to detect your network topology, respecting the connections and relations between nodes. At network interface level and layer 2 relations, information is presented automatically.

Keep in mind the relations between modules and agents to define the network topology you want to view.

In the following screenshot the available options for map-generating can be seen. You can select a group of agents (Group), a recon task (Recon task), or a network mask (CIDR IP mask).

network maps

If “Recon task” is selected the map design will show discovered nodes and any relations detected among them:

network maps

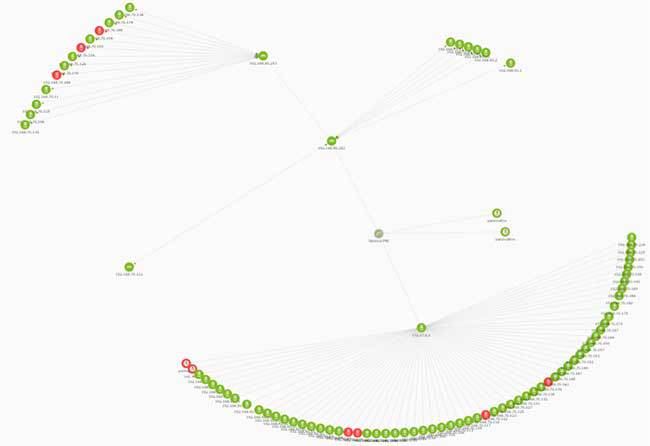
In a wider environment the perspective is going to be different: here you can see what a network map with more connected nodes would look like:

network maps

You can see how Pandora FMS connects to intermediary locations in the node diaspora. These locations usually correspond to routers, switches or access points.

Navigating network maps

Simpler than before, once a network map has been created you can move around it by simply dragging the mouse. Double-click or scroll to zoom in.

If you zoom in on a recon task-generated map you’ll see an image like the one below, allowing you to see relations between different map elements in more detail, including those at interface level.

network maps

It’s also easier to navigate map elements; simply drag and drop the elements, or scroll around the map at your leisure.

Editing maps

But there’s more; Pandora FMS 7’s maps are completely dynamic, meaning their default design can be modified, and elements displayed in the way that best suits the user. All intuitively and by simply using the mouse.

Double-click on any node on the map and you’ll see different edit options deployed, plus their relevant details. Likewise, you can now create, delete or modify relations between nodes and also their appearance.

network maps

To create a dependent relation between nodes or interfaces simply click on the node and create the relation by defining the parent and child element. You can also change the position of the node by dragging and dropping them on the map. If you need to move various nodes simultaneously, press “ctrl” and select the groups you want to move.

network maps

Right click on a node to deploy its options, see details or create a relation between two nodes at interface level, selecting the parent and child element respectively. Right click on a blank space to see the following options:

network maps

One of the most important labor-saving tools is the automatic generation of relations. This is possible thanks to self-discovery tasks, that allow relations between existing nodes to be automatically detected.

Last but not least, Pandora FMS 7 Next Generation includes the holding area. If you need to manually add new agents and relations to a pre-existing map, or if the recon task discovers new hosts, using the “refresh holding area” option will display nodes created or discovered subsequently in the “holding area”, and the original map will maintain its aesthetic, not being sullied with elements created a posteriori. Drag the new nodes out of the holding area to see its corresponding relations by clicking refresh.

In the Pandora FMS video “Network Maps” you can see everything we’ve explained in this article, and find out how to create, edit, and use a network map in a dynamic, graphic and easier way than in previous versions.


For more info visit https://pandorafms.com/ or our YouTube channel.

About Version 2 Digital

Version 2 Digital is one of the most dynamic IT companies in Asia. The company distributes a wide range of IT products across various areas including cyber security, cloud, data protection, end points, infrastructures, system monitoring, storage, networking, business productivity and communication products.

Through an extensive network of channels, point of sales, resellers, and partnership companies, Version 2 offers quality products and services which are highly acclaimed in the market. Its customers cover a wide spectrum which include Global 1000 enterprises, regional listed companies, different vertical industries, public utilities, Government, a vast number of successful SMEs, and consumers in various Asian cities.

About PandoraFMS
Pandora FMS is a flexible monitoring system, capable of monitoring devices, infrastructures, applications, services and business processes.
Of course, one of the things that Pandora FMS can control is the hard disks of your computers.

最好的16種網絡監控工具

As market and monitoring software evolve, deciding which of all network monitoring tools implement on your business becomes a difficult choice.

To help you choosing wisely, we have analyzed and compared the current best monitoring tools that solve your network monitoring requirements (both free and licensed).

Network monitoring tools in deep

Network monitoring is one of the most important sectors within all kinds of network tools. What we’ve done on this occasion is to use our experience with infrastructure monitoring tools to implement all of them for you to have the most complete analysis.

The objective is not to show that Pandora FMS is the best solution in network monitoring, but instead we mean to give a wide vision of all different solutions, so you can choose the best tool that adapts to your needs. Every installation is a world apart, and not all network tools are valid for every different environment.

Table of contents

  1. When to deploy a network monitoring tool?
  2. Network monitoring benefits
  3. Presales monitoring tool checklist
  4. Top 16 best monitoring tools & software review and comparison

Due to the success of the present article and the number of questions we have received, with queries about the different tools and softwares available and our criteria for choosing the right one for you, we have updated our analysis for you to have the most complete post.


Do you want to know more about network monitoring?

Remote networks, unified monitoring, intelligent thresholds… discover network monitoring in Pandora FMS Enterprise version.


When to deploy a network monitoring tool?

To ascertain whether this is the article you’re looking for, we’ll take a look at the conditions that determine if you need to install a network monitoring tool. Obviously, if you are already using network monitoring in your organization and just wish to upgrade the tool you use at the moment, you’ll know what we’re going to talk about here; just go ahead to the next section (network monitoring benefits).

For anyone else who is considering the topic for the first time, ask yourself:

  • Does my organization depend on network availability?
  • Is managing an ever-expanding IT infrastructure becoming overly time-consuming?
  • Is the growth of network traffic in my infrastructure exposing bottlenecks? Is the network scaled to optimize all my resources?

If these questions sound familiar, this article will help you answering them.

Network monitoring benefits

If proper software is chosen, main benefit of a network monitoring system is reducing costs, by avoiding company downtime and unproductivity periods. Even if you’re not motivated by profit, any organization (ONG, healthcare, public transport services…) can equally benefit by reducing lost time and streamlining their infrastructure.

Network monitoring and IT monitoring allow you to optimize both processes and resources. By giving you a global perspective of your infrastructure, you can see which nodes are bearing the strain of traffic, where you might need extra hardware and where your system is not scaled correctly. You can see where data is clogging up your system, and why and also what to do to sort out the situation.

This kind of software not only provides a heads up on when a problem is coming down the pipe, but how to avoid said problem or stop it from turning into a headache.

With a solid monitoring tool and a proper implementation, you will be able to detect malicious traffic, where is coming from and how to cancel it.

Even though, you will be capable of generating time-stamped data logs, allowing the system administrator to build up a collection of historical data that is invaluable both for analyzing how problems have been solved in the past, how your network responded to previously-logged events and allowing for prediction of how your system will behave in the future.

Presales monitoring tool checklist

We know better than anyone, that choosing the right network monitoring tool within the wide range of options that are available is a hard and complex issue. Furthermore, choosing the wrong one would certainly mean loosing time and money. Here at Pandora FMS’ headquarters, we have performed many installations based on previous wrongly implemented software.

In order to avoid these kind of implementation errors, we have created a presales checklist that covers all main elements that must be taken into consideration before choosing a monitoring tool.

  • Check that the software you’re interested in does not only monitor networks, but that it can also scale up in the case of a network expansion, with devices that includes apps, or hardware like servers, routers or switches. Making the right choice is the difference between growing smoothly, keeping everything under the oversight of a single tool, or incorporating more third-party software and losing the global, unified oversight a good network monitoring tool provides.
  • Keep in mind the question of compatibility. Are the servers and applications you’re already running going to be compatible with the new network monitoring software?
  • Be careful with licenses. Some companies take advantage of clients scaling up to introduce new licensing costs. Enquire about the cost of any additional licenses in the case of introducing new elements or components into your infrastructure.
  • Your software configuration and its management is very important. Some monitoring tools involve complex, almost bespoke, configurations that later require a more costly level of competence on behalf of your system administrator, making them almost essential for your company. We have seen cases of companies changing their monitoring tool because their system admin has left.
  • Ask your provider about their product’s scaling and performance capacities. Apart from the functional scalability already mentioned, network monitoring can also cover thousands of nodes and other elements under its aegis. In an interconnected world, businesses need to monitor other devices that are connected to its infrastructure, such as cell phones, vehicles or cash registers. In cases such as these is vital that your monitoring tool can provide monitoring to all these thousands of extra devices with maximum efficiency and performance.
  • To incorporate all these inevitable extra devices find out if your chosen tool comes with an API capable of integrating with other applications.
  • Alerts management. While it isn’t a problem managing alerts while you’re sat at the dashboard of your tool, what about when you’re not? Your chosen tool should be able to use multiple communication channels (email, SMS, messaging platforms) and them to be flexible enough to handle both the contents and the requirements of each platform.
  • If you’re working with virtual systems it’s imperative that your network monitoring software is also able to monitor those as well. With the idea in mind of expanding your virtual systems, does your tool monitor all your virtual and also the virtual infrastructure itself? Ditto for containers.
  • Do you need to inventory the components of your infrastructure and see them in a simplified way? Do you need to monitor offsite elements? If the answer is “Yes”, keep that in mind when you’re comparing softwares.
  • Monitoring embedded systems is another point to consider if you’re monitoring hardware that doesn’t use conventional systems. In Pandora FMS, for example, we’ve monitored fleets of buses, allowing operators to know the status of each vehicle thanks to monitoring their mechanical hardware.
  • Another aspect to bear in mind is generating and delivering reports. You need to show the status of the network to non-technical people, in a clear, exportable format, and directed at specific recipients who need different information. A one-size-fits-all is not acceptable here, which is why some monitoring solutions include customizable reports.
  • Monitoring with agents or agentless monitoring? The age-old question of whether you need to deploy agents will depend on the nature of your IT environment. Sometimes it isn’t possible to deploy an agent, and sometimes it’s the best solution on offer. Will your chosen monitoring tool allow you to decide?
  • Remote monitoring. If the networks to be monitored are geographically, or organizationally displaced, remote monitoring is your friend and ally. Keep disparate networks under observation from a central GUI.
  • Cloud monitoring. If all, or part, of your infrastructure isn’t already in the Cloud, it will be sooner or later. Does your network monitoring tool allow for hybrid monitoring (your own CPD and Cloud installation), and to consolidate everything in the same dashboard?
  • Saving and analyzing historic data is a crucial element of your network monitoring tool. It’s not only important to know what’s happening in real time but also to analyze past data, in order to make better informed decisions, and to modify your tool accordingly. Network monitoring is based on learning from historic metrics.
  • Finally, the GUI. Is it adaptable to your current and future requirements? Will its functionalities scale up as your system does?

Note: all tendencies commented on this article are measured on a worldwide scale.

Top 16 best network monitoring tools compared

As we said at the beginning, we are going to analyze all the monitoring software you can obtain today for you and your organization. We will summarize each tool and its usage trend in order to analyze pros and cons of using them.

Finally, we will talk about Pandora FMS as a comperhensive monitoring solution. A tool that, if you would like to monitor more than 100 different devices with its Enterprise solution, you can try 30 days for free.

1. Nagios

Nagios is probably the best known free tool, and it comes to no surprise since they’ve been working in the U.S. since 1996 to build this monitoring software. Nagios’ core is the most important part of the tool and allows you to build plugins to monitor single elements.

It’s interesting to see how the demand tendency on the Internet has been diminishing with the passage of time. What before was one of the most potent and well-known network tools, is losing terrain.

Interes mundial sobre Nagios

It’s large-scale use is due to the fact that it was the first one to develop a tool that covered unexpendable characteristics in a network monitoring process. For this reason, Nagios was very popular. Furthermore, given its great initial market penetration, it’s still quite used.

You can find in depth comparison between Nagios, Zenoss, Cacti, Zabbix and Pandora FMS in these articles:

In a nutshell, Nagios was the origin for monitoring and, as a matter of fact, lots of new network monitoring tools have inherited the Nagios code and made it evolve. Even though you may have a lot of professional profiles on the market, these must have a very vast knowledge of the program, and your installation will depend on them 100%. Future migrations may also be complicated.

Open version:  yes

Nagios PROS

  • There are a lot of professional profiles with Nagios experience
  • If there is a good knowledge of the tool involved, manual configuration can turn Nagios into a very powerful tool to monitor isolated or particular cases
  • It has a large plugin offer to adapt the product to the user’s final needs
  • Basic configuration is very easy

Nagios CONS

  • Editing or configuration processes are difficult due to the necessity to make manual modifications in order to properly set up the tool
  • The GUI lacks user-friendliness.
  • Steep and costly learning curve
  • Every installation ends up being a “puzzle” where rather than having a standard product, we finish with a personal appliance with hundreds of patches, self-made or third-party codes. All this apart from it being complicated to evolve or maintain by said third-parties.
  • Simple reports
  • Very lacking when it comes to SNMP, both in polling and trap management.

2. Zabbix

Developed by a Lithuanian company in 2005, Zabbix is known for being easy to configure and for having a very powerful GUI. It’s performance starts to decline when a large quantity of nodes is to be monitored. It’s agentless monitoring service stands out above the rest in its category.

Experience tells us you can monitor up to 10,000 nodes without performance issues.

We’ll show you the interest rate graph for Zabbix:

Interes en la herramienta de monitorizacion Zabbix a lo largo del tiempo

We’ve got the feeling that many Nagios users are moving over to Zabbix because it’s picked up on Nagios’ glove and it begins to have the visibility that Nagios used to have. The problem that we can see here is with its scaling on larger CPD’s. We have to tread carefully if our installation has various elements of the same type (for example databases) because their configurations will be complicated.

More in depth comparison here: Zabbix vs Nagios vs Pandora FMS.

Open version: Yes, Zabbix is an open software.

Zabbix PROS

  • It has quite an active community
  • At low levels, it’s still very strong and efficient.

Zabbix CONS

  • Even though it has been used for large installations, starting at 1,000 nodes its performance can be diminished
  • It’s difficult to create and define alert and report templates. Configurations can require many clicks and steps to be completed
  • It doesn’t include real-time reporting
  • Difficult to purge when there are errors
  • Poor SNMP trap treatment

3. GroundWork

An American company that reuses different software elements from Nagios, Icinga or Cacti to create a global solution. It has managed to be among the top ranked network monitoring tools thanks to its mashup of other tools.

Our experience with GroundWork hasn’t been bad, but we’ve seen complications when integrating its different modules. Also, it doesn’t have many plugins developed. For larger environments it falls short. It doesn’t show an extensive history when we monitor a lot of nodes and it doesn’t support platforms such as HP-UX or FreeBSD. If you don’t possess a large CPD  or lots of free time to tinker, we recommend checking it out since they have an interesting approach.

It’s search trend is, compared to others, residual and only focused on US market.

Open version: Yes.

GroundWork PROS

  • Has a powerful Cloud monitoring: AWS, Azure, CLoudera, Docker, Google Cloud, NedI, NetApp, OpenStack o VMware.

GroundWork CONS

  • Is not widely known
  • Lack of user community
  • Has not many plugins

4. Zenoss

Zenoss comes from an American enterprise that has created this software to monitor storage, networks, servers, applications, and virtual servers. It’s agentless monitoring is what makes it stand out. It has a “Community” version with very few features and a full-feature Commercial license.

Zenoss may seem interesting if you don’t really want to invest in monitoring software. If you don’t have that many machines and you don’t plan on investing in support or large features, then you can count on Zenoss as one of your network tools. Be careful though, Zenoss version 5 requires a very potent machine to run properly.

This is the internet trend that sees Zennos as a monitoring solution:

Interes a lo largo del tiempo de Zenoss software

Open version: Yes, but it may just be too limited

Zenoss PROS

  • All terrain regarding platforms. It’s capable of cross-platform monitoring
  • It presents a very flexible and tweakable dashboard, which is quite powerful as well
  • Great flexibility and potential in the event management offer.

Zenoss CONS

  • Depending on the installation’s complexity and on what elements need to be monitored, adapting it can be a rough task
  • The DataBase layer can get large and heavy in large environments.
  • The panel can be slow on certain installations.
  • It only has MySQL and its own database, lacking integration with other DataBase systems.
  • Topology maps are one of the weakness of the product.

5. Monitis

Focused toward small or medium-sized companies. It’s for them that this can arise as a great network tool, and for this reason we’re counting it among the 15 best network monitoring tools.

If you’re a small company, this may be the tool that best suits you. We do recommend you use the fully licensed version, since the free one is kind of basic and can be easily rendered useless unless you’re running a blog or similar webpage. If you’re a small company, this may be the tool you need.

This has been the trend evolution of Monitis monitoring tool:

Interes en Monitis como software de monitorizacion

Open version: There really is none. Although, they do offer their monitor.us version, but its features are really basic and recommended for simple websites or blogs.

Monitis PROS

  • Includes web transaction monitoring
  • Allows the user to monitor common cloud applications such as Amazon or Rackspace
  • Wonderful GUI which is both customizable and dynamic
  • Real-time reporting

Monitis CONS

  • Very focused on Linux and Windows
  • Has difficulties to add ad-hoc monitoring
  • Doesn’t have a free unlicensed version

Free version: There really is none. Although, they do offer their monitor.us version, but its features are really basic and recommended for simple websites or blogs.

6. Icinga

Icinga comes from part of the Nagios core, over which the GUI was improved. It can be integrated with many databases and its REST API interface is outstanding for integrating other applications. It’s focused on complex networks and monitoring protocols, machine resources and servers.

In 2009 a Nagios fork was created, and since then it’s followed its own path. In its last version (released 2014) they tried to fix performance issues by rewriting the core code. We think that it’s taking the same route as Nagios. It was well received back in 2009, but after a great launch, it started to fall back in demand terms. This is yet another monitoring tool that uses the Nagios core.

Evolucion del interes en Icinga que parte del core Nagios

Open version: Yes

Icinga PROS

  • Nagios core clone, technically improved.
  • Most of Nagios plugins and extensions work on Icinga

Icinga CONS

  • As Nagios, most of its configuration is based on scripts / text files.
  • It’s hard to integrate modern systems that requires more dynamism (virtual environments, cloud…)
  • Steep learning curve.

7. Manage Engine / OPManager

Manage Engine belongs to the Zoho Group, the giant enterprise conglomerate from India, and it’s one of those monitoring softwares to keep in mind. It’s tendency regarding demand is slightly on the rise.

Evolucion de las busquedas de manageengine a lo largo del tiempo

What we should warn about is its really steep learning curve, which may be expensive in resources, money and time in the beginning.

Open version: Non-existent

ManageEngine PROS

  • Easy to install
  • Very friendly GUI
  • Offers a very wide range of features to cover

ManageEngine CONS

  • Complex configurations that require a lot of documentation. Very steep learning curve.
  • Complicated user experience when navigating through its screens
  • Alarm levels limited to basics (warnings and critical status)
  • Only available on Linux and Windows
  • Lacks inventory and event correlation
  • Non-existing features for large environments that are acostumed to work with events, deployment on large architectures, etc.

8. Observium

Observium is a multiplatform web monitoring tool (mainly focused on Linux, Unix, HP). It’s a good tool, but it lacks basic features which in some cases we can recommend complementing with Nagios or Cacti.

Evolucion del interes en Observium a lo largo del tiempo

Open version: Yes.

Observium PROS

  • Graphs on Observium are known for their amount of detail and its careful design. It’s interesting for showing command panels on management levels.
  • Easy and useable interface
  • Capable of monitoring large installations

Observium CONS

  • We weren’t able to configure alerts on the free version.

9. Op5 Monitor

One of the monitoring tools that’s more focused on hardware, network traffic, and service monitoring. It’s based on Nagios as well.

It has the capability to monitor multiple platforms. It also monitors cloud systems and virtual environments. We can highlight it’s capacity when it comes to large environments and its scaling on these.

From 2008 to 2010 it had a raise in demand. Ever since then, it’s slow descent has begun. Its market is still Sweden, its country of origin.

Op5 Monitor y su demanda online

Open version: They have a free version

Op5 Monitor PROS

  • Easy to use
  • Very good load balancing system

Op5 Monitor CONS

  • Hard to extend features and monitoring processes on our own.
  • It won’t allow deployments from the console, so they have to be done manually

10. Opsview

A tool focused on network and application monitoring. It began developing in 2003, and like many other tools seen here, it started from a version of Nagios. It has a free version available.

In our office we personally like this product quite a lot, even if its demand is declining. Be careful with the tool’s performance.

The demand tendency for OPSView is quite similar to that of OP5, until 2012 it has a large raise, and from then on its decline has been quick.

Demanda de OPsView

Open version: Yes

OpsView PROS

  • It’s a rewritten Nagios, some of its plugins works in OpsView

OpsView CONS

  • Very rigid monitoring panel
  • Limited reports that cannot be exported
  • The amount of developed plugins is reduced

11. PRTG Network Monitor

Network monitoring tool that stands out for its greatly designed and easy to use interface. It has a great vantage point when it comes to configuring alerts flexibly and because of its report generating capacities. The free version (which is NOT open) is limited to monitoring 100 application types.

PRTG  is an application that can only be executed on Windows machines as a part of Microsoft Network Monitoring. Anyway, we highlight that the monitoring is multi-platform and is also able to monitor virtual systems and cloud applications. It can also generate real-time reports.

Despite decreasing, its trend has been stable throughout the years:

PRTG Network Monitor como software de monitoreo y su evolucion en trafico

Open version: Yes, but very reduced.

PRTG Network Monitor PROS

  • Very nice interface with awesome data navigation possibilities.
  • You can access monitoring from mobile devices
  • Reports can be in PDF/HTML formats
  • Very powerful and flexible alert system

PRTG Network Monitor CONS

  • Certain plugins require additional Microsoft user licenses, therefore costs can skyrocket easily
  • Limited scalability
  • Very rigid when implementing its own checks
  • Hard to deploy in environments with a complex connectivity
  • Quite inefficient when it comes to server or application monitoring

12. Solarwinds

Solarwinds is a network monitoring tool that excels for its automatic network and node mapping, without the need to manually activate it. This is added to a very powerful GUI that allows you to easily view your network topology and its status. Solarwinds also allows integrating virtual machines in its monitoring.

A very good option for medium sized companies that can afford the license costs (it’s one of the most expensive tools).

Its tendency shows that after a crushing success experienced during 2004 and 2005, a descent happened in which they’re now relatively stagnated. In fact, December 2020 abrupt rebound, far from being positive, marks the worst moment in Solarwinds Inc history, as it comes from the official notice of the hack Solarwinds systems suffered throughout several months.

Solarwinds a lo largo de los anos y el efecto del hackeo de Solarwinds

Open version: No.

Solarwinds PROS

  • Great GUI
  • Wonderful community backing it
  • Mobile device access

Solarwinds CONS

  • File and manual configuration for alerts
  • The report generation system still has room to improve
  • It doesn’t have integration with cloud applications such as Amazon
  • You cannot perform all actions from the same panel and you’ll always require to access other tools
  • Its licensing forces the user to constantly look at every check performed, since licensing is individually done for these.

13. Whatsup Gold

Whatsup Gold is one of the best network monitoring tools when it comes to balancing system loads. Its scaling is horizontal and allows the use of various processes to distribute loads. It’s capable of performing some automatic actions based on events that have occurred.

Just like other tools like SolarWinds or Pandora FMS, it has a system to discover networks and topologies.

By creating proprietary scripts you can add and integrate more applications or services within the monitoring.

We can also connect from mobile devices to access the monitoring panel. Alerts can be set to be sent via email, SMS or through other options and information is offered in real time.

Despite that, search trend is decreasing:

Whatsup Gold como herramienta de monitoring

Open version: No.

Whatsup Gold PROS

  • Easy to configure and process network discoveries
  • Reports

Whatsup Gold CONS

  • Navigation and console are not that intuitive
  • Configuration is split between web configurations and manual configurations on the console
  • Limited scalability
  • Quite poor for monitoring servers or applications

14. OpenNMS

After the large number of requests to review this monitoring tool, we have reviewed and added OpenNMS to this list.

OpenNMS is a 100% open source network monitoring tool, with no licensing requirements. The business model is to offer the software free and monetize it through consulting services, provided by the OpenNMS group, who administrate the product, through various business lines, including training and support services.

As one can see in the graph, demand for OpenNMS has been on a steady decline for the last decade.

OpenNMS a lo largo del tiempo

Open version: Yes.

OpenNMS PROS

  • It’s a flexible and high-capacity network monitoring tool, but one of its chief problems is the steep learning curve associated with it, plus an unintuitive GUI.
  • Integrates well with alert systems supports like SMS and email.
  • An active community around the tool, and a detailed wiki.
  • Can perform similarly to other, licensed products, but requires more time to learn to use and to configure

OpenNMS CONS

  • Requires a “hands-on” style of configuration, based on script editing and XMLs. In this aspect, it resembles Nagios a lot, in that a manual configuration can lead to highly idiosyncratic installations which can be difficult to decipher.
  • Importing third-party MIBs can be problematic.
  • The reports it is capable of generating are not polished enough for executive/management eyes, being quite basic visually, and without the possibility for fine-tuning intervals. In fact, it can’t present information in real-time, nor fine-tune intervals to below 24 hours.
  • Most importantly, OpenNMS, as its name suggests, is focused on network monitoring, and does not cover the full range of services which a more complete monitoring service can provide, such as server or application monitoring, and much less business processes and user experience. Due to its lack of agents, the information it can retrieve from the system under monitorization is limited to what is retrievable through SNMP, and that is not enough when it comes to monitoring applications or elements of server infrastructure. In some cases (not our own) it has been possible to use Nagios agents in an OpenNMS integration, although we can’t consider that an optimal solution.

15. Cacti

Cacti is a comprehensive monitoring solution for network graphic generation, designed to harness storage power and functionality for RRDtool app graphics.

Its user interface is easy to use, which is convenient for LAN sized systems.

Search trend Cacti evolution still has a solid foundation:

Evolucion del interes sobre Cacti herramienta de monitorizacion

Open version: Yes, it only has open version.

More in depth comparison here: Cacti vs Nagios vs Pandora FMS in depth comparison

Cacti PROS

  • Easy to instal and use.
  • Does what it say it does and makes what you expect from it.

Cacti CONS

  • Basic.
  • It’s only used for display data in graphics.
  • More modern tools (grafana) are replacing it.
  • It does not scales ok.
  • Some basic functionalities are missing in a monitoring environment (events, notifications, reports, SLAs, network maps, dashboards, multitenancy…).

16. Pandora FMS

The open version is capable of monitoring over 10,000 nodes and covers (without limitations) network, server (both with agents or remotely), and application monitoring. With features full of reports, alerts, and third party integrations through API, etc.

Differently from others, it doesn’t have Nagios core as a starting point. Instead, Pandora FMS created its own architecture from scratch, which allows perfect scaling for large environments. A network with over 100,000 nodes has been monitored with Pandora without performance issues (with the Enterprise version).

We also highlight its integration on mobile devices, which not only allows access to the console, but also to monitoring, thanks to its geolocation system.

Its network autodiscovery system is capable of finding all the elements that compose your network in a short time.

Time search evolution in Pandora Flexible Monitoring Software has been stable, with some isolated variations:

Evolucion del interes en pandora fms a lo largo del tiempo

Open version: Yes.

More in depth comparison here:

Pandora FMS PROS

  • Capable of every monitoring type (servers, networks, applications…) with a single console.
  • Great flexibility and scalability (dozens of thousands of devices).
  • Dynamic network maps, reports, SLA’s, integrated notifications, service’s maps, events, logs…, and more.
  • It’s an all-in-one monitoring software.

Pandora FMS CONS

  • Community not as big as Zabbix’s or Nagios’

Conclusions

We know that there’s a lot of competition and many options, and it is honestly quite difficult to choose the best option. With this monitoring tool comparison guide you’d have all you need to make proper decision

Most network monitoring tools that we mention are meant for small and medium enterprises. It’s difficult to find tools for large companies that actually cut it for them in performance, and that also support different technologies and protocols that this type of company needs. Within this category we can mention ZenOSS and Pandora FMS.

You should also take into account that this article discusses network monitoring tools and, today, it’s more important not only to know the status of networks and applications, but to be able to understand how a business works, from the bit that goes along a network cable, to sales being done at a specific time by a specific company. This point is related to business activity monitoring, or operational intelligence; but that’s better left for another article.

About Version 2 Digital

Version 2 Digital is one of the most dynamic IT companies in Asia. The company distributes a wide range of IT products across various areas including cyber security, cloud, data protection, end points, infrastructures, system monitoring, storage, networking, business productivity and communication products.

Through an extensive network of channels, point of sales, resellers, and partnership companies, Version 2 offers quality products and services which are highly acclaimed in the market. Its customers cover a wide spectrum which include Global 1000 enterprises, regional listed companies, different vertical industries, public utilities, Government, a vast number of successful SMEs, and consumers in various Asian cities.

About PandoraFMS
Pandora FMS is a flexible monitoring system, capable of monitoring devices, infrastructures, applications, services and business processes.
Of course, one of the things that Pandora FMS can control is the hard disks of your computers.

你知道這些IP掃描儀嗎?

Close your eyes. Imagine that, instead of being a good person reading this article at home, you are a newbie network administrator who must manage the IP addresses of thousands of devices networked on the extensive networks of a large company. 

At first you use your spreadsheet…, but it’s not enough! 

The tension increases and the temptation to jump out the window of the office may be too much sometimes, but thanks to the Blessed Sacrament, this text comes to mind (and to Google) where Pandora FMS blog tells you about…

Best IP Scanners, IP Scanner Tools

Listen to us, as so many times you did before. The IP Scanner or IP scanner tools are the way to save you an unattainable job on the fast track. 
So let yourself be carried away by the scroll of your trusted mouse, read carefully and select the option that best suits you.

Advanced IP Scanner

At the controls of this ipscan we find Famatech, a world leader in software development for remote control and network management. 

In case you have any doubts, this company has already been endorsed by millions of IT professionals around the world.

Almost all of us use Famatech’s award-winning software products.

In the distant 2002, they launched Advanced IP Scanner (which continues to be developed and improved every day) and this tool proves to be of the most integral and effective to manage LAN networks and carry out all kinds of network tasks. 

One of the unquestionable strongpoints of Advanced IP Scanner is that Famatech takes user recommendations on the improvement of the product seriously and gets down to work quickly.

In addition, Advanced IP Scanner integrates with Radmin, another one of the most popular Famatech products to create remote technical support.

This technological Megazord expands the capacities of the IP Scanner and can simplify your work as system administrator.
IBM, Sony, Nokia, HP, Siemens and Samsung, have already joined in, surely you can’t be left behind!

Free IP Scanner

Perhaps the fastest in the wild-west scanning IP ranges, in addition to ports geared primarily for administrators and users who want to monitor their networks.

Free IP Scanner has the unique ability to scan a hundred computers per second, and it does so with ease due to its recursive process technology that greatly increases scanning speed.

It even gives you the possibility to find out the busy IP addresses within the same network and shows you the NetBIOS data of each machine. 

These data, from the name to the group, including the MAC address, can be exported to a plain text file.

With Free IP Scanner you may also define scanning by IP address range, simultaneous maximum processes or ports.

All of this for free.  

IP Range Scanner

Lansweeper offers us this tool for free. How much we like free stuff, huh? 

If Stone City had an ad that read “Free stones”, we would be able to take a car full of stones home. 

We’d do something with them!  

IP Range Scanner is able to scan your network and provide all that information you are looking forward to knowing about devices connected to your network.

You may also schedule a network scan and run it when prompted.

#IPRangeScannerYourNewButler

OpUtils

Some consider “OpUtils” to be a supervillain’s name. However, nothing further from the truth. 

It’s a super software for IP address management and switching port that rescues IT administrators from trees and helps them manage switches and IP address space with ease. 
In its belt we find more than 30 network tools, which help us perform network monitoring tasks. Including:

  • The super intrusion detector of fraudulent devices.
  • The bandwidth usage supercontroller.
  • Supervisor of the availability of critical devices.
  • The Cisco Configuration File Backup Superrunner.

Network Scanner

Network Scanner, almost the panacea

The IP Scanner they use to scan both large corporate networks with thousands of devices and small businesses with a few computers.

The number of computers and subnets is unlimited.

And it can scan a list of IP addresses, computers, and IP address ranges and show you all the resources shared.

Including: 

  • System shared resources. 
  • NetBIOS Hidden (Samba) 
  • FTP and web resources.

Ideal for auditing network computers or using it to search for available network resources.

Both network administrators and regular users can use Network Scanner.
And Network Scanner will not only find network computers and shares, it will also check their access rights so that the user can build them as a network drive or open them in their browser.

Conclusions

Here are just a few examples of the top of the best IP Scanners on the market. We know you’ll have a hard time deciding. 

It’s like when they put a tray of assorted sushi in front of you. 

There’s no way to decree which one’s best while you’re still salivating. 

Anyway, let’s name a couple more options for you to burst into uncertainty. We’re that good!

  • IP Address Manager
  • PRTG Network Monitor
  • Angry IP Scanner
  • IP Scanner by Spiceworks
  • NMAP

About Version 2 Digital

Version 2 Digital is one of the most dynamic IT companies in Asia. The company distributes a wide range of IT products across various areas including cyber security, cloud, data protection, end points, infrastructures, system monitoring, storage, networking, business productivity and communication products.

Through an extensive network of channels, point of sales, resellers, and partnership companies, Version 2 offers quality products and services which are highly acclaimed in the market. Its customers cover a wide spectrum which include Global 1000 enterprises, regional listed companies, different vertical industries, public utilities, Government, a vast number of successful SMEs, and consumers in various Asian cities.

About PandoraFMS
Pandora FMS is a flexible monitoring system, capable of monitoring devices, infrastructures, applications, services and business processes.
Of course, one of the things that Pandora FMS can control is the hard disks of your computers.

普羅米修斯網絡監控:一個新的開源時代

Prometheus seeks to be a new generation within open source monitoring tools. A different approach with no legacies from the past.

For years, many monitoring tools have been linked to Nagios for its architecture and philosophy or directly for being a complete fork (CheckMk, Centreon, OpsView, Icinga, Naemon, Shinken, Vigilo NMS, NetXMS, OP5 and others).

Prometheus software, however, is true to the “Open” spirit: if you want to use it, you will have to put together several different parts.

Somehow, like Nagios, we can say that it is a kind of monitoring Ikea: you will be able to do many things with it, but you will need to put the pieces together yourself and devote a lot of time to it.

Prometheus network monitoring architecture

Prometheus, written in the go programming language, has an architecture based on the integration of third-party free technologies:

Prometheus kubernetes monitoring

Unlike other well-known systems, which also have many plugins and parts to present maps, Prometheus needs third parties to, for example, display data (Grafana) or execute notifications (Pagerduty).

All those high-level elements can be replaced by other pieces, but Prometheus is part of an ecosystem, not a single tool. That’s why it has exporters and key pieces that in the background are other Opensource projects:

  • HAProxy
  • StatsD
  • Graphite
  • Grafana
  • Pagerduty
  • OpsGenie
  • and we could go on and on.

What is Prometheus monitoring?

As we mentioned, Prometheus is an open-source monitoring tool.

The main difference with the rest of the tools we have, is that Prometheus is conceived as a framework for collecting data of undefined structure (key value), rather than as a monitoring tool. This allows you to define a syntax for your evaluation and thus store only in case of change events.

If you’re familiar with RRD, you’re thinking the right thing.

Prometheus does not store data in an SQL database.

Like Graphite, which does something similar, like other systems from another generation that store numerical series in RRD files, Prometheus stores each data series in a special file. 

If you are looking for a Time series database information gathering tool, you should take a look at OpenTSBD, InfluxDB or Graphite.

What to use Prometheus for?

Or rather, why NOT use Prometheus.

They themselves say it on their website: if you are going to use this tool to collect logs, DO NOT DO it, they propose ELK instead.

If you want to use Prometheus to monitor applications, servers or remote computers using SNMP, you may do so and generate beautiful graphics with Grafana, but first of all…

Prometheus Settings

All Prometheus software configuration is done in YAML text files, with a rather complex syntax. In addition, each employed exporter has its own independent configuration file.

In the event of a configuration change, you will need to restart the service to make sure it takes the changes.

Prometheus reports

By default, Prometheus monitoring has no report type.

You will have to program them yourself using their API to retrieve data.

Of course, there are some independent projects to achieve this.

Dashboards and visual displays

To have a dashboard in Prometheus, you’ll need to integrate it with Grafana.

There is documentation of how to do this, as Grafana and Prometheus coexist amicably.

Scalability in Prometheus

If you need to process more data sources in Prometheus, you may always add more servers.

Each server processes its own workload, because each Prometheus server is independent and can work even if its peers fail. 

Of course, you will have to “divide” the servers by functional areas to be able to differentiate them, e.g.: “service A, service B”. So that each server is independent.

There does not seem to be a way to “scale” as we understand it, since there is no way to synchronize, recover data and it does not have high availability or a common access framework to information on different independent servers.

But as we warned at the beginning, this is not a “closed” solution but a framework for designing your own final solution.

Of course, there is no doubt that Prometheus is able to absorb a lot of information, following another order of magnitude than other better known tools.

Monitoring with Prometheus: exporters and collectors

Somehow, each different “way” of obtaining information with this tool, needs a piece of software that they call “exporter”.

It is still a binary with its own YAML configuration file that must be managed independently (with its own daemon, configuration file, etc.).

It would be the equivalent of a “plugin” in Nagios.

So, for example, Prometheus has exporters for SNMP (snmp_exporter), log monitoring (grok_exporter), and so on.

Example of configuring an snmp exporter as a service:

Prometheus monitoring exporter SNMP

To get information from a host, you may install a “node_exporter” that works as a conventional agent, similar to those of Nagios.

These “node_exporters” collect metrics of different types, in what they call “collectors”.

By default, Prometheus has activated dozens of these collectors. You may check them all by navigating to Annex 1: active collectors.

And, in addition, there are a multitude of “exporters” or plugins, to obtain information from different hardware and software systems.

Although the number of exporters is relevant (about 200), it does not reach the level of plugins available for Nagios (more than 2000).

Here we have included an example of an Oracle exporter.

Conclusion

Prometheus’ approach for modern monitoring is much more flexible than that of older tools. Thanks to its philosophy, you may integrate it into hybrid environments more easily.

However, you will miss reports, dashboards and a centralized configuration management system.

That is, an interface that allows observing and monitoring information grouped in services / hosts.

Because Prometheus is a data processing ecosystem, not a common IT monitoring system.

Its power in data processing is far superior, but the use of that data for day-to-day use makes it extremely complex to manage, as it requires many configuration files, many distributed external commands and everything must be maintained manually.

Appendix 1: Collectors active in Prometheus

Here are the collectors that Prometheus has active by default:

These “node_exporter” collect metrics of different types, in what they call “collectors”, these are the serial collectors that are activated:

arp Exposes ARP statistics from /proc/net/arp.
bcache Exposes bcache statistics from /sys/fs/bcache/.
bonding Exposes the number of configured and active slaves of Linux bonding interfaces.
btrfs Exposes btrfs statistics
boottime Exposes system boot time derived from the kern.boottime sysctl.
conntrack Shows conntrack statistics (does nothing if no /proc/sys/net/netfilter/ present).
cpu Exposes CPU statistics
cpufreq Exposes CPU frequency statistics
diskstats Exposes disk I/O statistics.
dmi Expose Desktop Management Interface (DMI) info from /sys/class/dmi/id/
edac Exposes error detection and correction statistics.
entropy Exposes available entropy.
exec Exposes execution statistics.
fibrechannel Exposes fibre channel information and statistics from /sys/class/fc_host/.
filefd Exposes file descriptor statistics from /proc/sys/fs/file-nr.
filesystem Exposes filesystem statistics, such as disk space used.
hwmon Expose hardware monitoring and sensor data from /sys/class/hwmon/.
infiniband Exposes network statistics specific to InfiniBand and Intel OmniPath configurations.
ipvs Exposes IPVS status from /proc/net/ip_vs and stats from /proc/net/ip_vs_stats.
loadavg Exposes load average.
mdadm Exposes statistics about devices in /proc/mdstat (does nothing if no /proc/mdstat present).
meminfo Exposes memory statistics.
netclass Exposes network interface info from /sys/class/net/
netdev Exposes network interface statistics such as bytes transferred.
netstat Exposes network statistics from /proc/net/netstat. This is the same information as netstat -s.
nfs Exposes NFS client statistics from /proc/net/rpc/nfs. This is the same information as nfsstat -c.
nfsd Exposes NFS kernel server statistics from /proc/net/rpc/nfsd. This is the same information as nfsstat -s.
nvme Exposes NVMe info from /sys/class/nvme/
os Expose OS release info from /etc/os-release or /usr/lib/os-release
powersupplyclass Exposes Power Supply statistics from /sys/class/power_supply
pressure Exposes pressure stall statistics from /proc/pressure/.
rapl Exposes various statistics from /sys/class/powercap.
schedstat Exposes task scheduler statistics from /proc/schedstat.
sockstat Exposes various statistics from /proc/net/sockstat.
softnet Exposes statistics from /proc/net/softnet_stat.
stat Exposes various statistics from /proc/stat. This includes boot time, forks and interrupts.
tapestats Exposes statistics from /sys/class/scsi_tape.
textfile Exposes statistics read from local disk. The –collector.textfile.directory flag must be set.
thermal Exposes thermal statistics like pmset -g therm.
thermal_zone Exposes thermal zone & cooling device statistics from /sys/class/thermal.
time Exposes the current system time.
timex Exposes selected adjtimex(2) system call stats.
udp_queues Exposes UDP total lengths of the rx_queue and tx_queue from /proc/net/udp and /proc/net/udp6.
uname Exposes system information as provided by the uname system call.
vmstat Exposes statistics from /proc/vmstat.
xfs Exposes XFS runtime statistics.
zfs Exposes ZFS performance statistics.
Colectores activos por defecto en Prometheus

Appendix 2: Oracle exporter example

This is an example of the type of information that an Oracle exporter returns, which is invoked by configuring a file and a set of environment variables that define credentials and SID:

  • oracledb_exporter_last_scrape_duration_seconds
  • oracledb_exporter_last_scrape_error
  • oracledb_exporter_scrapes_total
  • oracledb_up
  • oracledb_activity_execute_count
  • oracledb_activity_parse_count_total
  • oracledb_activity_user_commits
  • oracledb_activity_user_rollbacks
  • oracledb_sessions_activity
  • oracledb_wait_time_application
  • oracledb_wait_time_commit
  • oracledb_wait_time_concurrency
  • oracledb_wait_time_configuration
  • oracledb_wait_time_network
  • oracledb_wait_time_other
  • oracledb_wait_time_scheduler
  • oracledb_wait_time_system_io
  • oracledb_wait_time_user_io
  • oracledb_tablespace_bytes
  • oracledb_tablespace_max_bytes
  • oracledb_tablespace_free
  • oracledb_tablespace_used_percent
  • oracledb_process_count
  • oracledb_resource_current_utilization
  • oracledb_resource_limit_value

To get an idea of how an exporter is configured, let’s look at an example, with an JMX exporter configuration file:

---
startDelaySeconds: 0
hostPort: 127.0.0.1:1234
username: 
password: 
jmxUrl: service:jmx:rmi:///jndi/rmi://127.0.0.1:1234/jmxrmi
ssl: false
lowercaseOutputName: false
lowercaseOutputLabelNames: false
whitelistObjectNames: ["org.apache.cassandra.metrics:*"]
blacklistObjectNames: ["org.apache.cassandra.metrics:type=ColumnFamily,*"]
rules:
  - pattern: 'org.apache.cassandra.metrics<type=(\w+), name=(\w+)><>Value: (\d+)'
    name: cassandra_$1_$2
    value: $3
    valueFactor: 0.001
    labels: {}
    help: "Cassandra metric $1 $2"
    cache: false
    type: GAUGE
    attrNameSnakeCase: false

About Version 2 Digital

Version 2 Digital is one of the most dynamic IT companies in Asia. The company distributes a wide range of IT products across various areas including cyber security, cloud, data protection, end points, infrastructures, system monitoring, storage, networking, business productivity and communication products.

Through an extensive network of channels, point of sales, resellers, and partnership companies, Version 2 offers quality products and services which are highly acclaimed in the market. Its customers cover a wide spectrum which include Global 1000 enterprises, regional listed companies, different vertical industries, public utilities, Government, a vast number of successful SMEs, and consumers in various Asian cities.

About PandoraFMS
Pandora FMS is a flexible monitoring system, capable of monitoring devices, infrastructures, applications, services and business processes.
Of course, one of the things that Pandora FMS can control is the hard disks of your computers.

找到你想找的IT工作

When you leave the faculty with a smile on your face and after the undertow of the graduation celebration, you hope that the great multinationals approach you with hundreds and varied jobs. “Take this huge sum of money and work on what you always dreamed of”…

But nothing could be further from the truth.

For that reason, today in Pandora FMS blog, we give you our sincere condolences for facing that load of hunting for a job related to “your stuff” and a couple of pages totally necessary to find an IT job.

*We know that there are millions of specialized people that look for an article like this, from water stocker in IT to those who prepare a megalomaniac IA in their garage, but this time we have wanted to focus on looking for an IT job

** Even so, these pages are very versatile and are helpful for many more specialties. Look among them for a job that suits your specialties.

Do you know where you have to look for an IT job?

Ticjob

Good stuff: Ticjob. We dive right into it with one of the most valued portals of IT jobs in Spain

Go in, thread between the offers with enough precision, since you can choose among role categories, development, system, business… Choose and forget about it. Soon you will find something!

If I were you, I would sign up immediately, because you may find companies that usually do not appear in other more well-known platforms. 

TalentHackers

Talent Hackers. We already explained to you why you don’t have to fear the word “hacker”, because it can have positive connotations and, of course, it has them here.

We face here a very singular platform for job hunting

Its aim is to catch talents within the technological scope through one distributed network. That is, by means of searching and picking up professionals through references later repaid. 

What does this mean?
It means that if the candidate which you recommend for a position is the selected one you can take up to 3,000 bucks.

Manfred

Manfred: “We manage talent, not selection processes”. With this quote, the company makes clear that it is not a common portal.

Rather, Manfred claims to be a platform that offers “IT recruitment” and gives the candidate an experience totally different from that we are used to with the rest of this type of services.

Manfred takes less into account the necessities of the companies and worries more about the programmers that look for a job.

  1. You sign up.
  2. You are assigned a person that will be in charge of you, who will inform you about the most interesting opportunities that comply with the profile which you previously detailed.
  3. You are advised with the utmost respect.
  4. You realize everything is for free for IT profiles and they only charge companies that hire them.

TekkieFinder

“We are the ONLY job portal that PAYS you whenever a company contacts you.” This is what TekkieFinder promises. Do you like the idea?

Is very easy: You register, fill in your profile happily, they get you in their database and, here’s the good stuff, when a company is interested in you, it buys your profile from TekkieFinder to be able contact you, and whether you are interested in the offer or not, you get paid!

There is such a shortage of IT professionals that it is changing the way to take control over them. They are like exotic legendary pokemon hidden behind an ancient glitch. What IT professional wouldn’t be thrilled with this platform?

Circular

Looking for something truly individualized and round? Get in Circular

Circular is similar to the previous employment portal mentioned: Manfred. Although it gives you a less personal feeling than Manfred, among the Spanish platforms, it is the best one in this feature.

Circular, like the dating application Tinder, it gathers companies and applicants all together. 

First, you sign up, then a friend of yours/contact within the platform recommends you, since if they do not do it, you will not be able to contact the companies, and that’s it!

GeeksHubs

GeeksHubs is without a doubt one of the best options if you look for an IT job in Spain. 

Systems/DevOps, Back-end, Front-end, Mobile, FullStack,… These are some of the categories that you will be able to find in your sector. In addition to enough information on each vacancy, so that it becomes clear whether it interests you or not. 

And, in addition, they say how much they are willing to pay you, which is the most interesting part and it is what many hide. 

Growara

 Growara gets in your shoes and it never offers to its users a project in which they themselves would not work. In fact, it seems that they only work with companies that are actually worth it.

They never ghost you, since they seem to feed on the feedback that you can offer them.

The best thing? They don’t bother spamming you with thousands of offers that do not have anything to do with your professional development. They look for precise and elegant matches that meet your values and capacities.

Tecnoempleo

Tecnoempleo is that portal specialized in computer science, telecommunications and technology that you’re looking for.

More than half a million candidates and 27 thousand companies guarantee its 20 years of professional expertise in the sector.

Although just for having its own mobile app, and specific sections for working abroad or remotely, or looking for your first job, I would choose it hands down.

Primer Empleo

If you are a newbie this is your site, Primer Empleo.

A job portal founded in 2002 and directed specifically to students and recent graduates without labor experience.

So if you have a junior profile and you want to check it out, go ahead. Even if you have not even finished your grade and you are only looking for an internship, it is quite interesting.

Jooble 

Jooble and Jooble Mexico are websites that take you to many and a wide range of existing job offers in other pages.  Perhaps you lose some time signing up to each one of them, but it may be worth it if you end up getting your way. 

It is worth pointing out that, if you get a job thanks to this article, you should treat us to something, even if it’s just a coffee. Always depending on the job you got and its consequent remuneration, of course!

Conclusions

Looking for a job is a task that is already too ungrateful for you to not accept our help through this article and these links. After all, we have been there and we know how lost and frustrated one can feel.

Good luck and take courage in your job hunting!

About Version 2 Digital

Version 2 Digital is one of the most dynamic IT companies in Asia. The company distributes a wide range of IT products across various areas including cyber security, cloud, data protection, end points, infrastructures, system monitoring, storage, networking, business productivity and communication products.

Through an extensive network of channels, point of sales, resellers, and partnership companies, Version 2 offers quality products and services which are highly acclaimed in the market. Its customers cover a wide spectrum which include Global 1000 enterprises, regional listed companies, different vertical industries, public utilities, Government, a vast number of successful SMEs, and consumers in various Asian cities.

About PandoraFMS
Pandora FMS is a flexible monitoring system, capable of monitoring devices, infrastructures, applications, services and business processes.
Of course, one of the things that Pandora FMS can control is the hard disks of your computers.